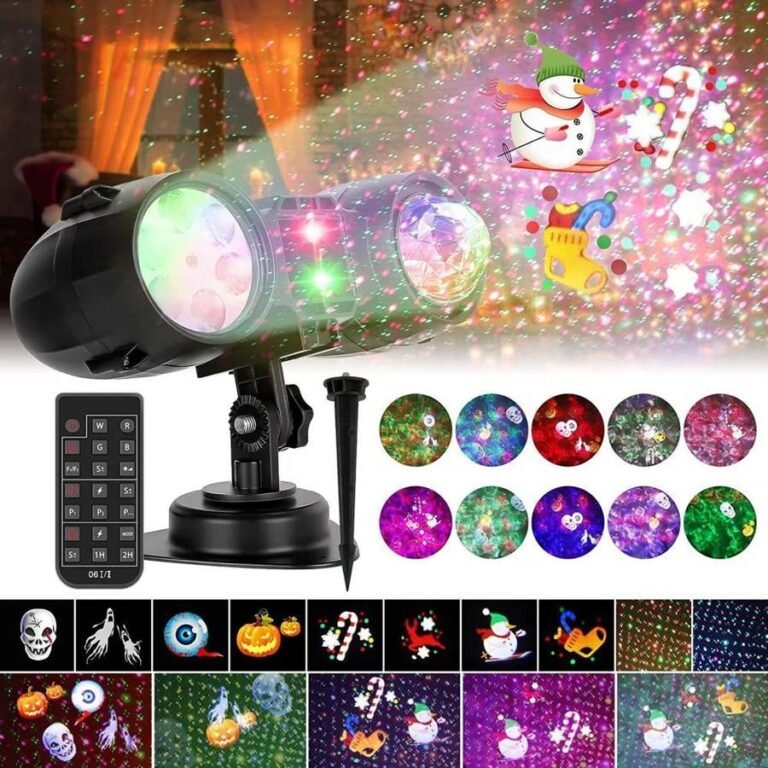

A buyer sends me three outdoor laser light projector quotations. One leads with lumens, one gives a coverage area, and one gives a throw distance. The spreadsheet makes them look like three versions of the same answer, so the natural next step is to rank the largest number. I cross out that ranking before I compare the products. The problem is not that every number is false. The problem is that each number describes a different part of the system, and the conditions connecting them are usually absent.
Lumens, coverage area, and throw distance cannot be converted into one fair projector score by themselves. A buyer also needs the effect type, optical geometry, target surface, ambient light, and a definition of what “usable” looks like. Without those conditions, a large figure is a marketing input—not a unit-count promise or an acceptance result.
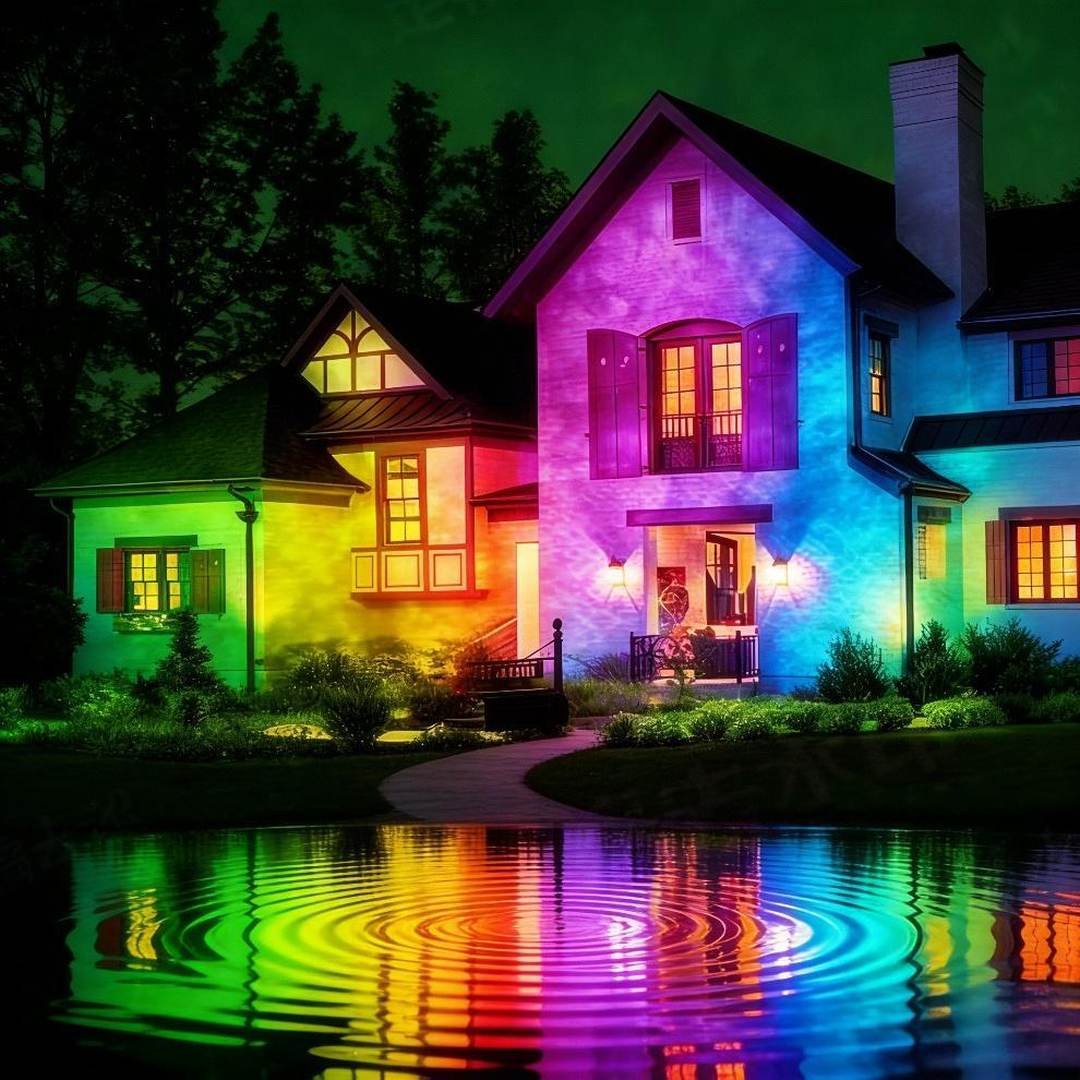
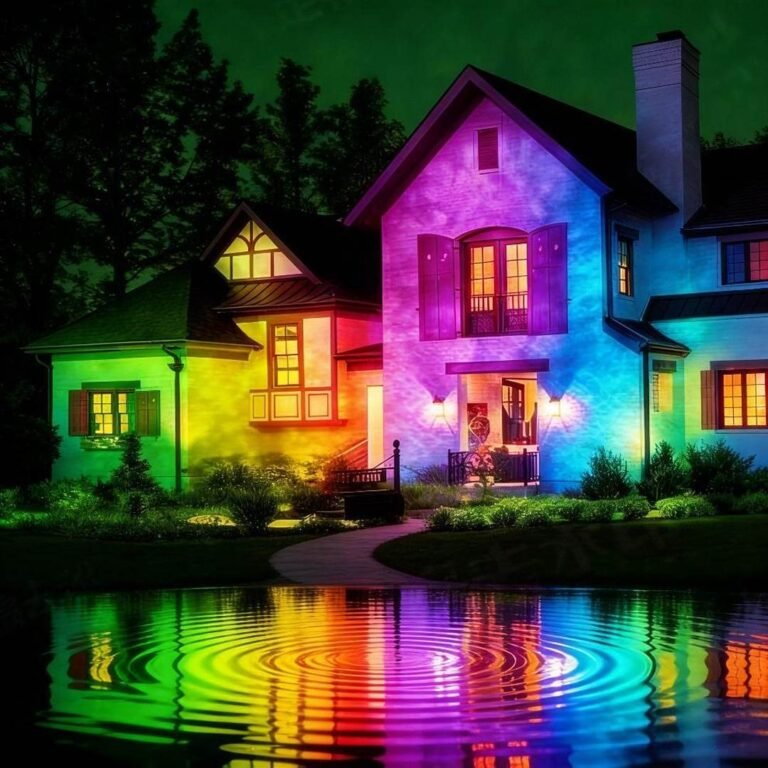
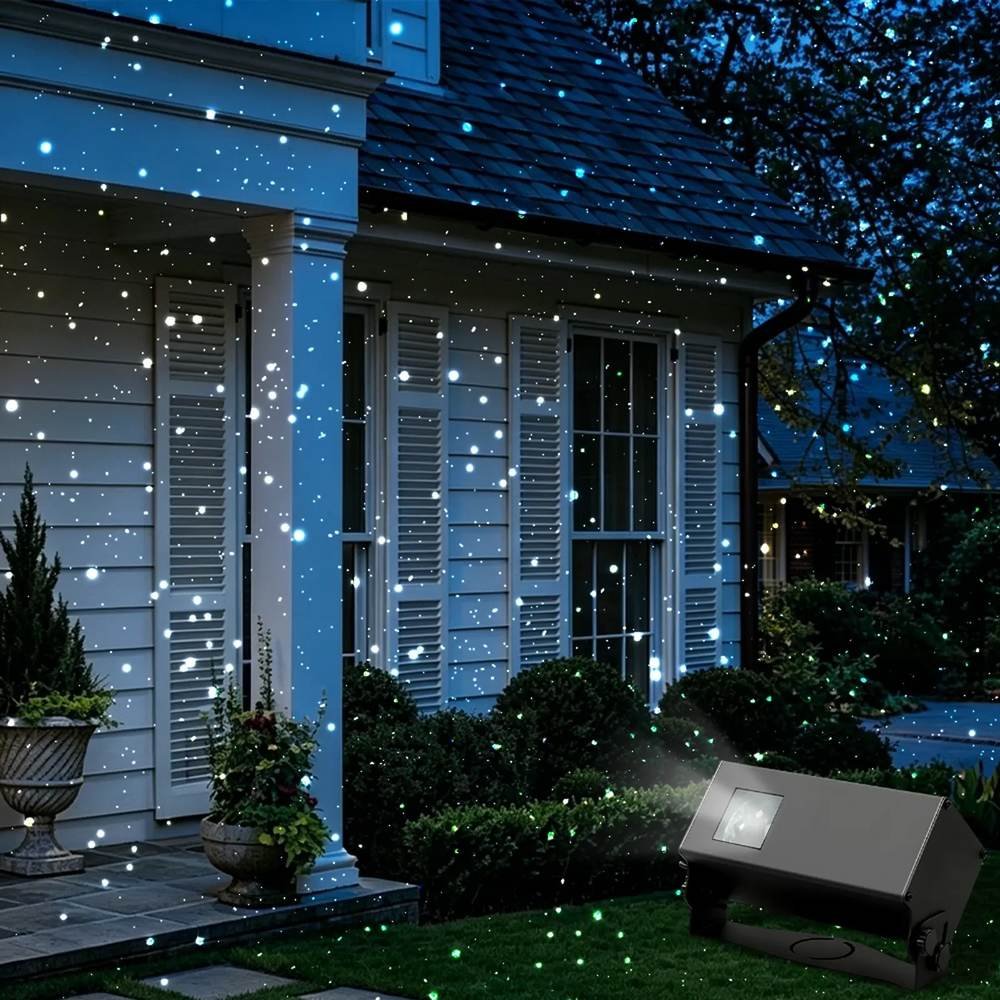
This BWL-OL-003 image shows why the distinction matters. The coloured ripple appears across several surfaces, but the photograph does not tell us the distance, ambient light, surface reflectance, camera exposure, or where an observer would say the usable effect ends. It shows the visual concept; it does not measure coverage. Below, I separate the three quantities, explain what our own records can and cannot support, and give commercial buyers a repeatable way to estimate a site without pretending that total facade area is enough.
Can Lumens Tell You How Much Area an Outdoor Projector Will Cover?
Lumens look like the cleanest comparison because they are a recognised light-output unit. I still ask what was measured, how it was measured, and how the projector distributes that output before I let the figure influence a buying decision.
Lumens describe visible luminous flux; they do not directly specify pattern size, contrast, sharpness, point density, or usable coverage.1 Even a legitimate lumen value cannot predict a decorative result unless the buyer also knows the optical distribution, effect type, distance, surface, and competing light.
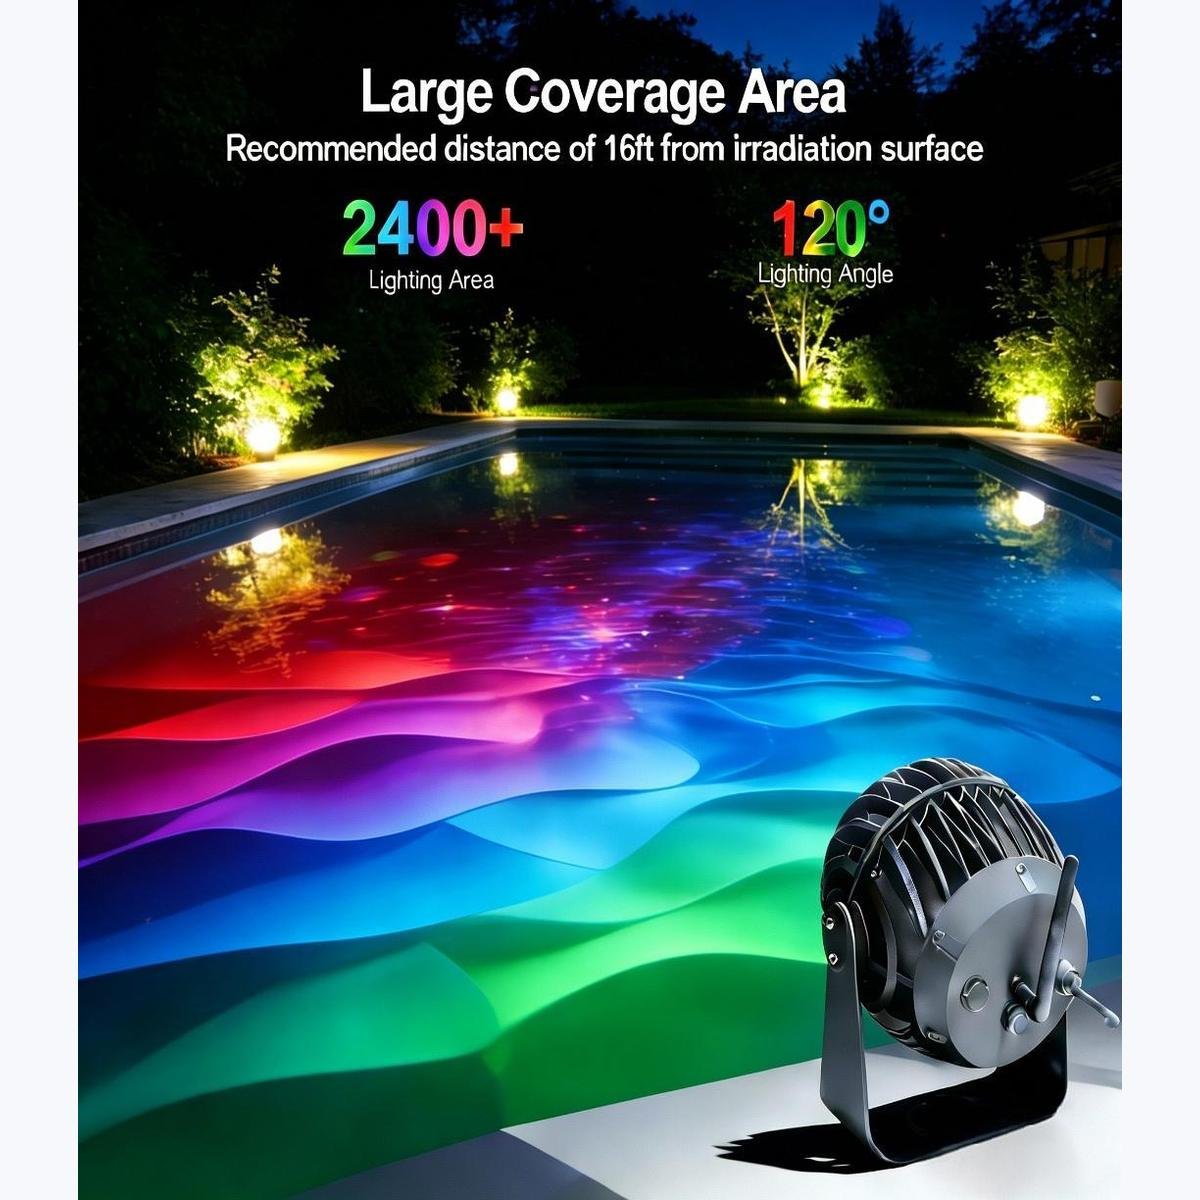
The BWL-OL-003 promotional card contains several performance-style figures. I do not repeat those printed figures as an acceptance promise because the card does not define the measurement method or the usable-result threshold. The image is a real Bowlum asset and the product identity is clear. The missing part is the chain that would let another person reproduce the claim.
Luminous Flux Is an Input to the Visual Result
Lumens weight visible light according to human visual response and express an amount of luminous flux.2 That can be a useful quantity when two products use a comparable measurement method and deliver light in a comparable way. Decorative projection breaks that assumption easily. One optical system may spread a textured field, another may create separated points, and another may form recognisable holiday images.
The same total flux can be distributed over a tight or wide field.3 It can be concentrated into points or spread through a soft background. Some output may land outside the target surface. None of those differences is explained by the lumen figure alone.
I therefore keep four questions attached to any lumen claim:
- What quantity is being reported? Measured luminous flux, an LED component rating, electrical input, and a marketing brightness label are different things.
- What method produced it? A number without a method cannot be compared with a number produced another way.
- Which exact configuration was measured? Optical parts, effect mode, colour, and control setting can change the result being observed.
- What site result is the buyer trying to protect? A recognisable snowflake, a dense point field, and a broad water-ripple texture need different acceptance language.
| Paper metric | What it can describe | What it cannot establish alone | Missing bridge to the site |
|---|---|---|---|
| Lumens | Visible luminous flux under a stated method | Pattern definition, contrast, density, or area | Optical distribution, effect mode, surface, ambient light |
| Throw distance | Separation from projector to target | Field size or usable visibility | Projection geometry, orientation, focus, surface, output |
| Coverage area | A claimed or observed footprint | Why that boundary was chosen | Distance, threshold, surface, ambient light, observer method |
| Electrical power | Input or rated electrical quantity, if correctly labelled | Visible output or coverage | Efficiency, optics, control mode, measurement method |
When a specification sheet substitutes electrical power for lumens, I do not calculate a conversion. Electrical input moves through the driver, light source, optics, and effect mechanism before a viewer sees anything. The conversion is not a universal constant.4
Why Can’t Throw Distance and Coverage Area Be Converted Into Each Other?
A distance and an area appear geometrically connected, so buyers often expect one to generate the other. I separate the paper geometry from the usable visual result because only the first can be estimated without seeing the effect.
Throw distance can predict a footprint only when the projection angle or equivalent optical geometry and orientation are known. It still cannot predict usable coverage without output distribution, focus, effect density, target surface, ambient light, and an acceptance threshold. Distance tells you where the projector sits; it does not tell you whether the result survives there.
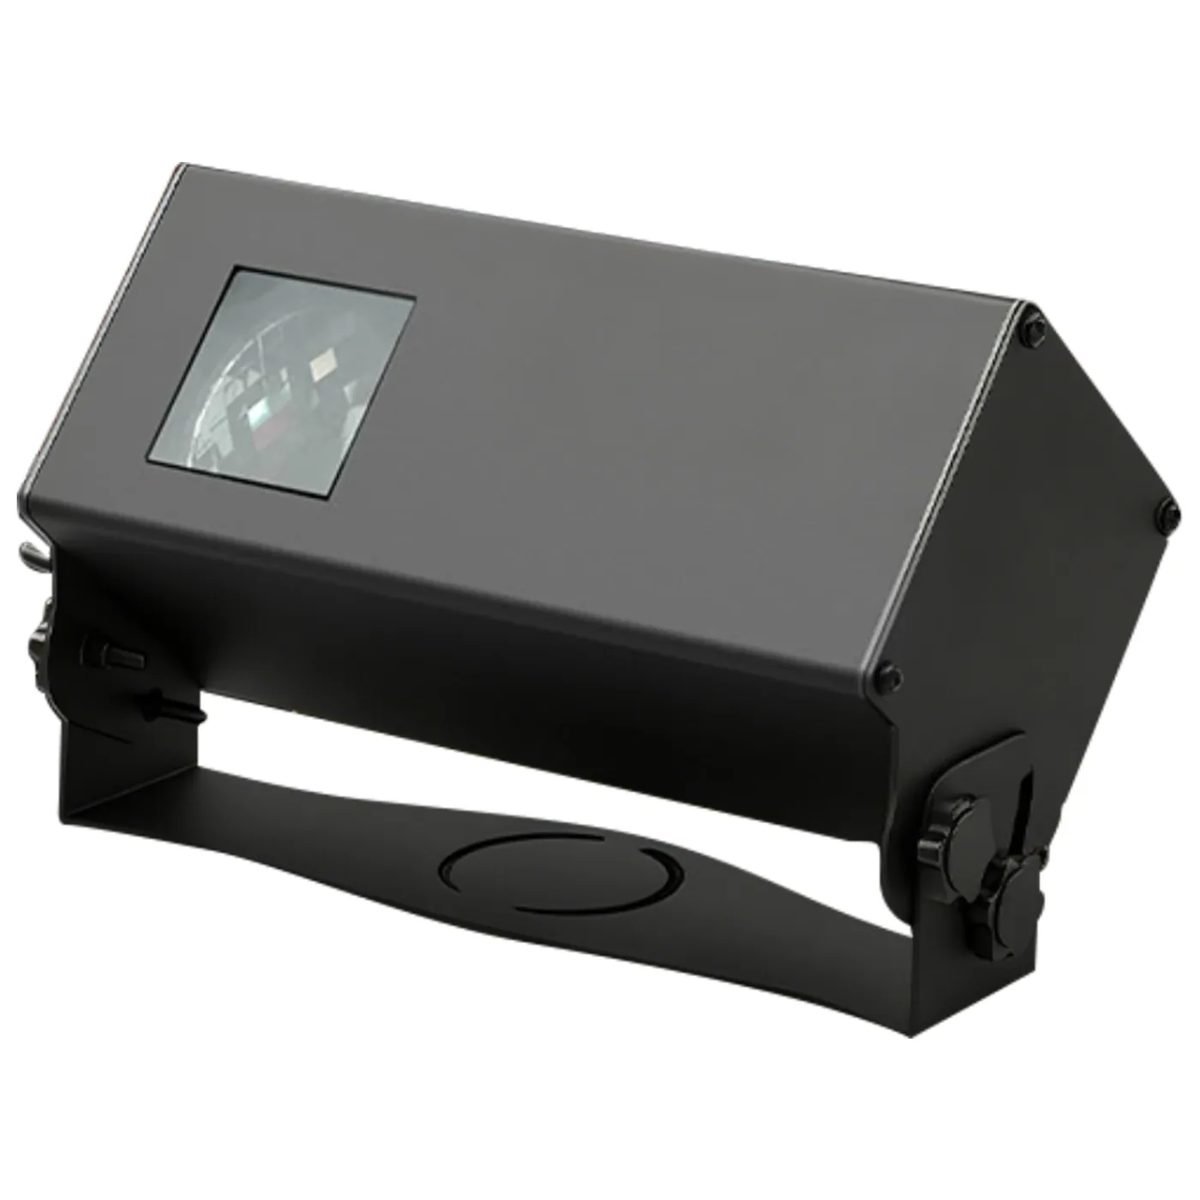
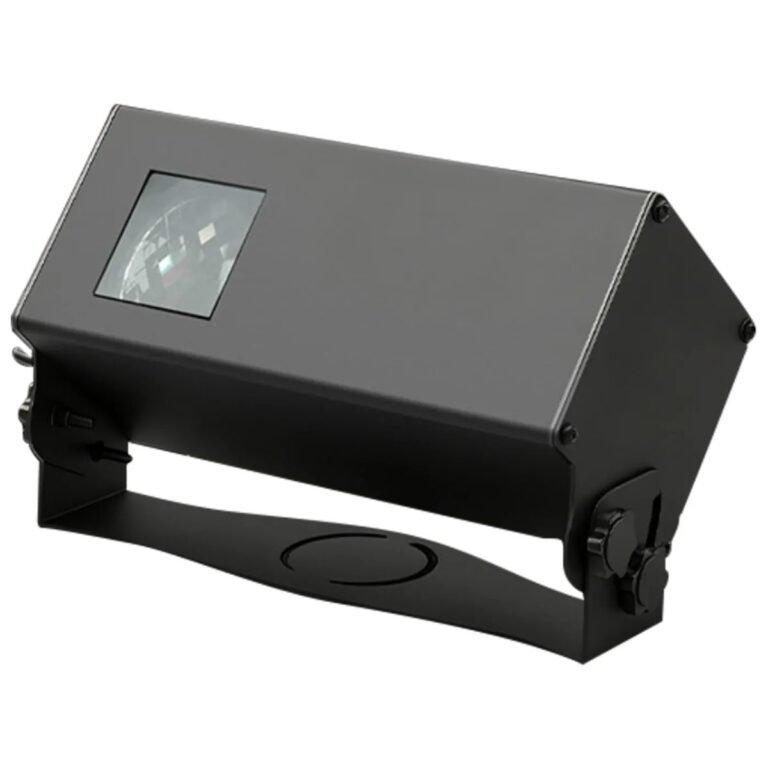
The BWL-OL-001 housing image confirms the product form, optical window, and adjustable bracket visible in the photograph. It cannot tell a buyer the full field geometry or how the pattern behaves on a real facade. A clean product shot is identity evidence, not a throw chart.
The Simple Geometry and the Commercial Reality
In a simplified fixed-angle model, the projected width and height grow roughly in proportion to distance. The footprint area therefore grows roughly with the square of distance.5 That relationship explains why moving a projector farther back can create a larger field.
It does not say the larger field remains useful. The same output is being distributed differently, point spacing may increase, a textured effect may lose contrast, and a recognisable pattern may become less legible.6 Real optics, focus limits, target angle, cropping, and obstructions also move the result away from a simple cone.7
| If throw distance increases in a fixed-angle model | Geometric change | Visual risk the geometry does not answer |
|---|---|---|
| Projected width and height | Grow approximately with distance | Edges may no longer remain defined or on the intended surface |
| Mathematical footprint | Grows approximately with distance squared | More of the footprint may fall below the usable threshold |
| Point spacing in a fixed point pattern | Increases with distance | The field can look sparse even though the footprint is larger |
| Light distributed over the target | Spread across a larger field | Contrast can fall against competing light |
| Obstruction and spill | Often affect more of the field | Windows, trees, rooflines, signs, and neighbouring surfaces can interrupt the result |
This is why I will not divide two quoted distances and turn the ratio into a coverage claim. The calculation would silently assume equal optical angle, equal distribution, equal effect type, equal surface, and equal ambient conditions. Those are the variables the buyer is actually trying to compare.
A mathematical footprint answers “where can light land?” Usable coverage answers “where does the agreed effect still work?”8 Never make one stand in for the other.
The same boundary matters when comparing products in our outdoor projector range. Category membership makes the products relevant to the same buying conversation; it does not make their optical outputs interchangeable.
What Do Bowlum’s Own Coverage Figures Actually Prove?
It is easy for a factory to criticise incomplete marketplace specifications. I checked our own source chain first, and the result is more useful than claiming we have perfect data.
Some Bowlum outdoor distance and area figures had real outdoor measurement and extrapolation behind them, but the original distance, surface, ambient-light, and acceptance conditions were not retained with the ranges. The numbers were not invented, yet they cannot be reproduced from the surviving record and must not be treated as site guarantees.
Our current catalog contains 38 product records. Eight contain a projection-distance or projection-area value. The other 30 stay blank because the source records do not provide those fields; we do not copy a nearby model’s range to make the table look complete.
BWL-OL-001 is one of the products whose catalog records a 5–20 m projection-distance range and 50–300 m² projection-area range. Factory follow-up confirmed that figures in this group were based on outdoor measurements and extrapolation. The surviving quotation and data records preserve the figures, but not the conditions that created the usable boundary.
That creates a precise limitation:
- It would be wrong to say the product was never measured.
- It would also be wrong to say the surviving range predicts a new facade.
- The correct statement is that the measurement result survived while its reproducibility record did not.
| Record state | What I can say | What I will not infer |
|---|---|---|
| Value and conditions retained | The result can be reviewed and a matched method can be planned | That every site will produce the same result |
| Value retained, conditions missing | The number has source history but needs a new site-specific check | A guaranteed area or an exact unit count |
| Field blank at source | The public record remains blank | A value copied from a visually similar model |
| Effect photograph available | The product can create the visible type of effect shown | Distance, exposure, area, brightness, or field performance not recorded in the image |
I describe this as a documentation gap, not a product-quality confession. These are different systems. Product checks can occur and a published performance field can still lose its context later. A buyer needs both: a controlled product and a controlled description of how a performance claim was produced.
The already-published guide on firefly projector listing claims and repeatable specifications goes deeper into dot count and firefly-specific RFQ wording. Here, the broader lesson is that a real measurement is not automatically a portable comparison. Portability requires the method to travel with the result.
How Should Different Decorative Projector Effects Be Compared?
Projectors are often placed in one spreadsheet because they all throw light onto a surface. I ask the buyer to define the visual job before comparing the numbers, because a point field, a moving texture, and a recognisable image do not fail in the same way.
Compare decorative projectors by the effect-specific result the site needs—not by a universal brightness or area score. Point effects need density and contrast, textured effects need continuity and movement across the target, and image effects need recognisability, focus, and framing under the actual viewing conditions.
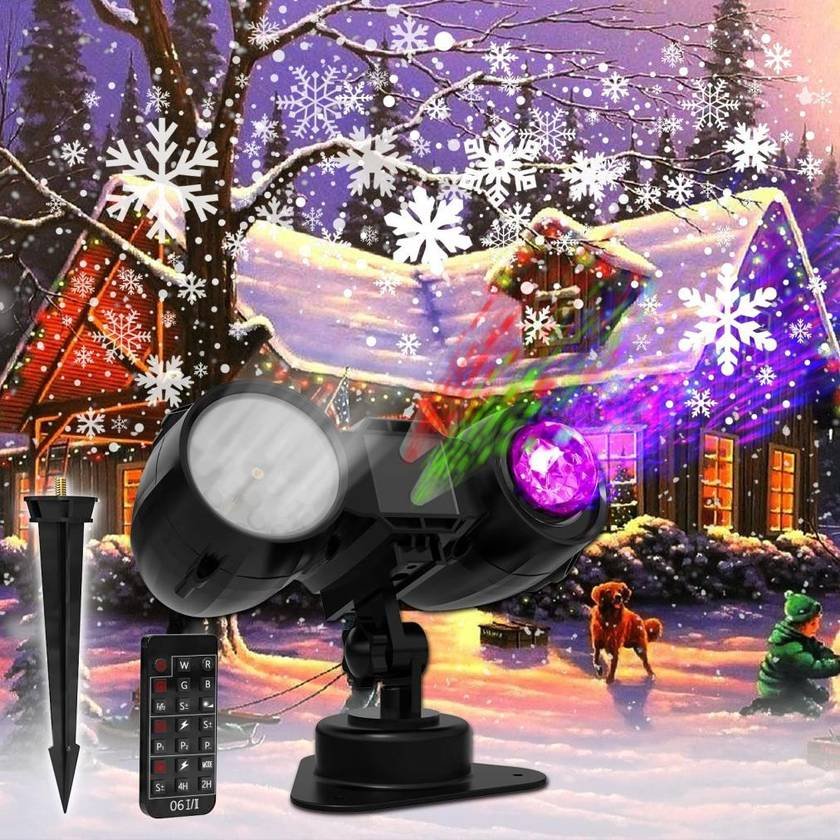
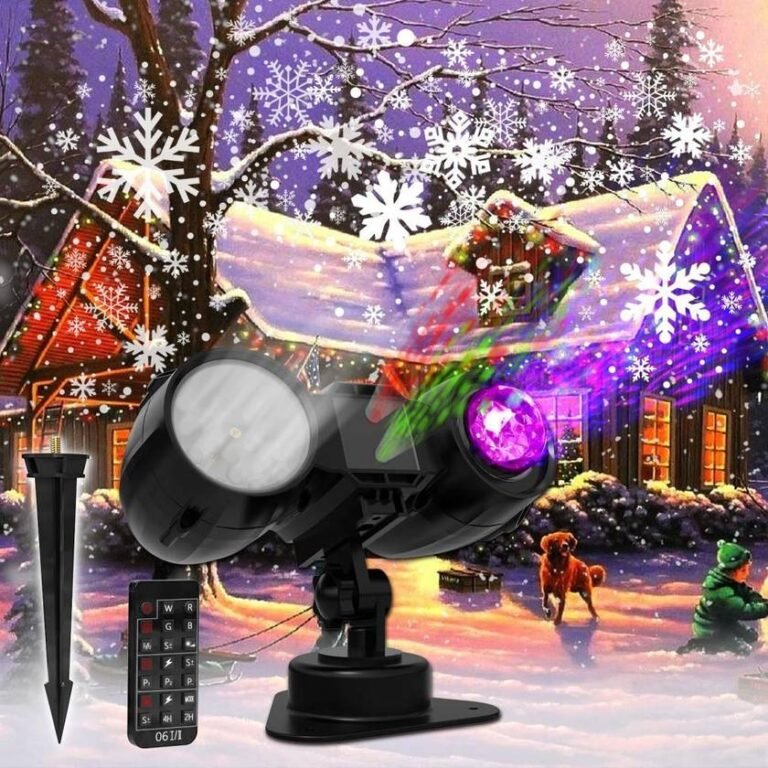
BWL-HP-003 visually combines a snowflake theme with a coloured background effect. Its source record leaves projection distance and area blank. That blank does not prove the product is weak; it proves that I do not have a source-backed area or distance field to publish for this SKU. A sample review should therefore begin with the intended snowflake result and installation conditions, not a range borrowed from BWL-OL-001 or BWL-OL-003.
Give Each Effect Family Its Own Pass Condition
| Effect family | What the buyer is trying to preserve | Useful observation | Misleading shortcut |
|---|---|---|---|
| Separated point field | Perceived density and contrast across the intended surface | Are points distinguishable and appropriately distributed from the viewing position? | Maximum area without a density threshold |
| Water-ripple or other textured field | Continuous texture, colour, movement, and coverage of the intended feature | Does the texture remain visible and coherent across the target under normal lighting? | Treating a single bright patch as full coverage |
| Recognisable holiday image | Legibility, focus, scale, framing, and theme clarity | Can viewers identify the image where it is meant to appear? | Comparing only total spread or electrical power |
| Mixed optical effect | Balance between the separate channels and modes | Does the approved mode reproduce the intended hierarchy of effects? | Combining unlike channels into one brightness figure |
This table is not a claim that one family is superior. It prevents a buyer from rewarding the wrong attribute. A very wide point field can be commercially weaker if the points look sparse. A smaller holiday image can be stronger if it remains legible in the intended frame. A ripple can cross architectural boundaries intentionally, while a logo or snowflake may need to stay inside one surface.
I use the buyer’s merchandising promise as the final filter. If a brand will advertise “moving colour across a water feature,” the acceptance record should protect continuity and movement. If an installer has sold a recognisable seasonal motif, the record should protect legibility and framing. The specification must describe the promise the downstream customer will actually judge.
How Many Christmas Projectors Does a Commercial Facade Need?
“How many Christmas projectors do I need?” sounds like an area-division problem. I treat it as a site-zoning problem because total square metres hide the exact surfaces and competing light that determine whether each position works.
Do not divide the facade’s total area by a catalog maximum. Divide the site into zones with similar surface, distance, viewing, obstruction, and ambient-light conditions; validate the most difficult representative zone; then assign units from approved positions with overlap and service access considered separately.
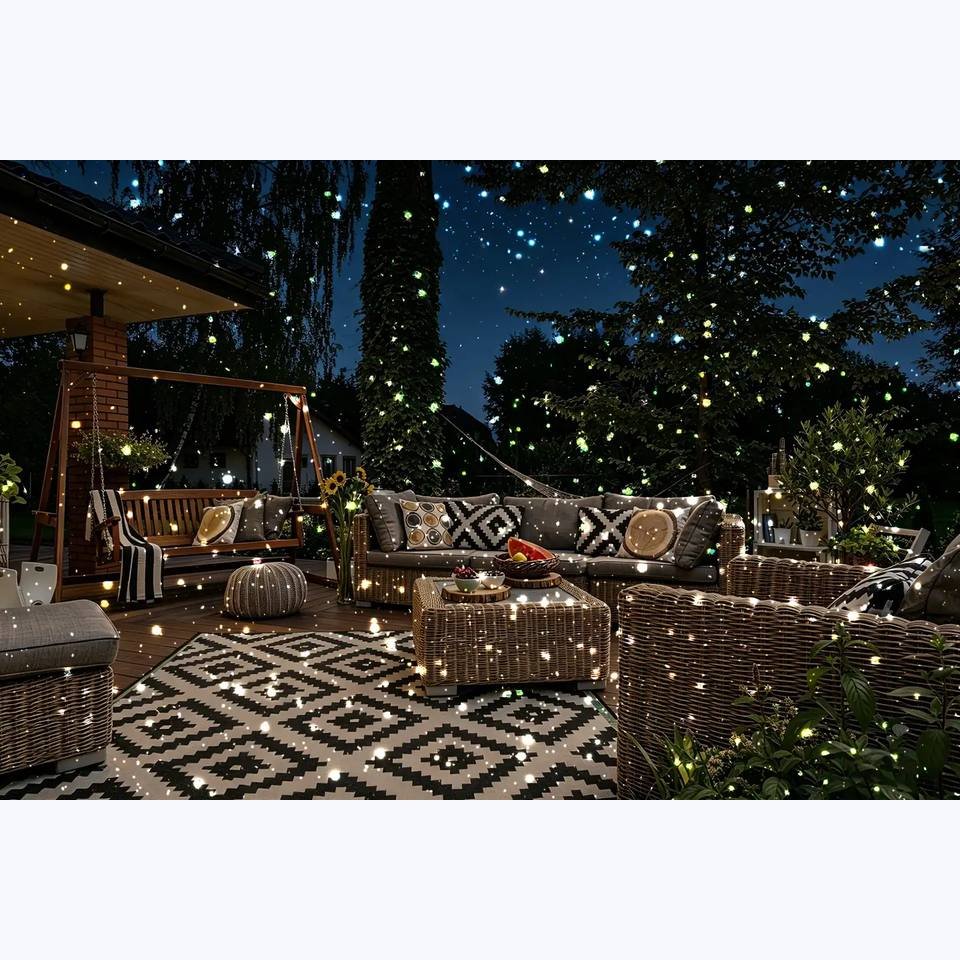
The patio image above contains pale flooring, dark foliage, furniture, vertical supports, and a covered area. Calling it one coverage rectangle would erase the very differences that make the effect appear stronger in one place and weaker in another.
Turn the Site Into Testable Zones
I build a first-pass site sheet with these columns:
| Zone input | What to record | Why it changes the plan |
|---|---|---|
| Target surface | Material, colour, texture, openings, foliage, and boundaries | Alters reflection, continuity, and where the effect can land |
| Mounting position | Available location, orientation, and distance to the target | Determines possible footprint and focus geometry |
| Competing light | Normal operating condition with the projector off9 | Changes background brightness and visible contrast |
| Viewing position | Where the intended audience actually sees the effect | Changes perceived density, framing, and obstruction |
| Visual job | Point texture, ripple, image, or mixed effect | Determines the correct pass condition |
| Access and service | Safe adjustment, power route, replacement, and re-aiming access | Prevents an optically possible position from becoming an operational problem |
After the zones exist, the buyer can choose a difficult representative area for a matched sample check. A test at the easiest dark wall proves little about the bright entrance or the dark foliage beside it. The hardest relevant zone is usually the better place to learn whether the concept is viable.
When a Facade-Area Spreadsheet Stopped Being the Plan
A commercial décor contractor on the West Coast once sent me a product table for a shopping-centre facade. The candidates were ranked by declared coverage area, and the total facade area had already been divided by the largest figure. The site elevation, however, showed several surface materials and existing facade lighting. One number was being asked to solve several different optical problems.
I did not replace the buyer’s number with one of ours. I marked the likely mounting positions, split the facade into zones, and asked which parts had to carry a recognisable seasonal image and which only needed atmospheric texture. I also moved the normal facade-lighting condition into the sample brief instead of treating it as a problem to discover after installation.
The contractor’s next step changed from selecting the highest paper coverage to requesting matched checks for the difficult zones. The useful outcome was not a new universal unit count. It was a plan in which every proposed unit had a position, a target, a visual job, and a condition under which the result could be approved.
Count projectors after the site has been divided into optical jobs. Counting before that only turns a catalog assumption into a larger catalog assumption.
What Should a Supplier Record So Two Projectors Can Be Compared?
A matched test does not need to be a laboratory report for every sourcing decision. It does need enough control that the buyer can tell whether two products faced the same task and whether the bulk unit can be checked against the approved sample.
Record the exact SKU and mode, throw geometry, target surface, ambient-light condition, camera or observer position, and effect-specific pass criterion. Keep those conditions fixed across samples. A comparison without this condition sheet measures presentation skill as much as projector performance.
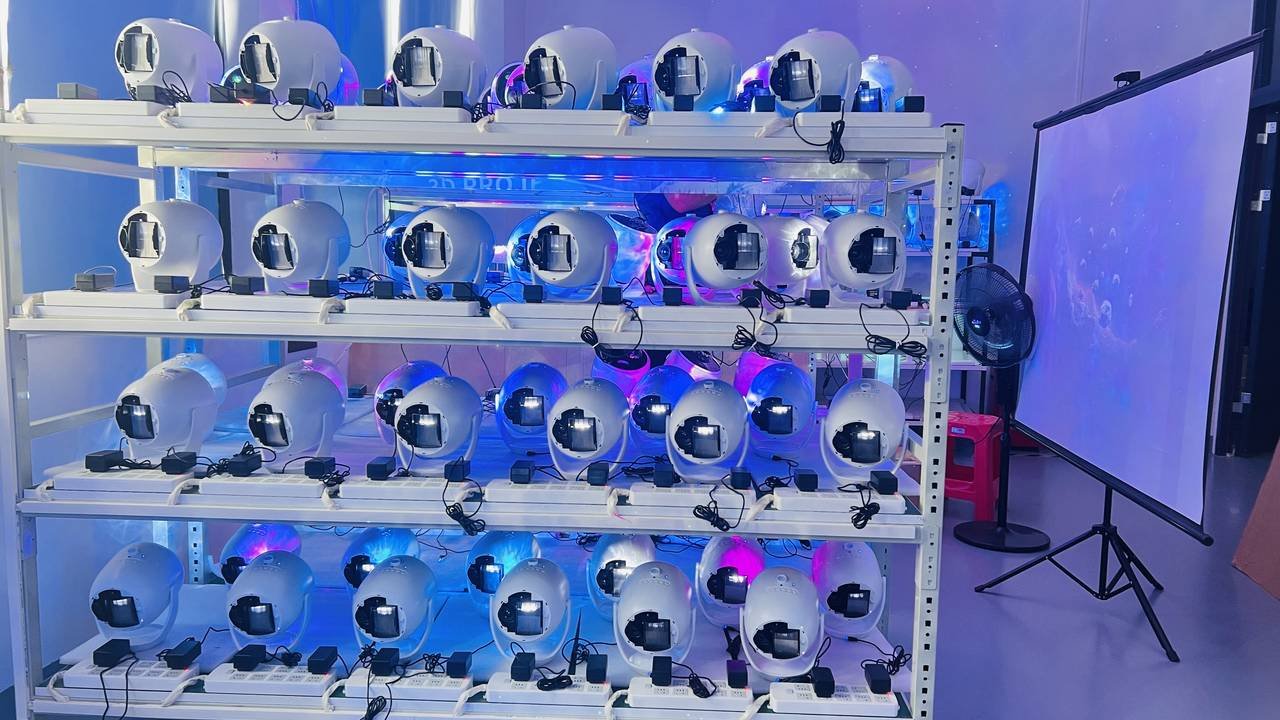
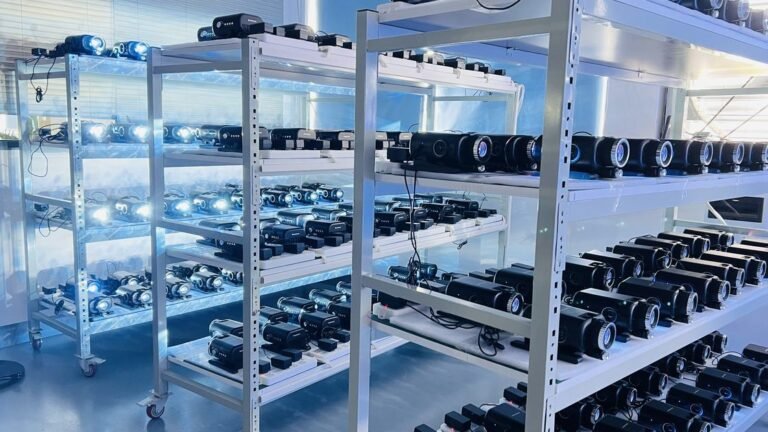
This is a real Bowlum factory process image, but it is not outdoor coverage evidence for BWL-OL-001, BWL-OL-003, or BWL-HP-003. It shows rows of powered projector units and a nearby screen. To support a performance comparison, the record would still need to identify the exact products, settings, distance, target, surrounding light, and observation method.
A Comparison Sheet That Can Survive Procurement Review
| Record field | Minimum useful entry | Why it belongs in the file |
|---|---|---|
| Product identity | Exact public SKU, configuration, and effect mode | Prevents a result from drifting onto another model or mode |
| Output label | State exactly what a quoted number represents and how it was obtained | Stops electrical, component, and optical quantities being mixed |
| Throw geometry | Lens-to-target distance, orientation, and relevant field geometry | Makes the physical setup repeatable |
| Target | Surface material, colour, texture, dimensions, and angle | Preserves the surface that created the observed result |
| Ambient condition | Normal site lighting recorded with the projector off | Preserves the background against which contrast was judged |
| Observation | Viewing position and, if photos or video are used, a fixed camera setup10 | Reduces changes caused by perspective or automatic exposure |
| Pass criterion | Effect-specific statement of density, continuity, legibility, framing, or another agreed outcome | Turns “looks good” into a shared decision |
| Reference | Approved sample and dated record | Gives later checks a physical and documentary anchor |
I also separate sample approval from shipment control. A sample can prove that one configuration can create the intended effect under the recorded conditions. It does not by itself prove that every later unit matches it. The buyer still needs an incoming or shipment check tied to the same product identity and acceptance reference.
Our factory uses production checks, including approximately eight hours of aging per unit and a Class 1 release requirement for laser products in our own laser test room. Those controls answer whether the unit completed defined production gates. They do not turn an unconditioned coverage range into a facade guarantee. Production control and application validation protect different risks.
Before I approve a comparison sheet, I read every row as a question: could another person reproduce this setup without calling the writer for missing context? If the answer is no, the sheet is not finished—even when every cell contains a number.
A useful projector specification is not the one with the most numbers. It is the one that lets two people repeat the same decision.
The broader Bowlum product catalog keeps unknown values open rather than silently inheriting them. Buyers can apply the same rule to any supplier: completeness is valuable only when the source and method are complete too.
Conclusion
Comparing outdoor projectors is not a contest among lumens, metres, and square metres. It is a translation from an optical system into a site promise. The three figures can become useful, but only after the buyer defines the effect, geometry, surface, competing light, viewing position, and pass condition that connect them. Our own historical ranges show why this discipline matters: a measurement can be real while the conditions needed to reproduce it are lost. For the next comparison, leave the universal score blank. Build one condition sheet, test the difficult zone, and assign each unit only after its optical job is clear. That is the rule I use when a neat spreadsheet is trying to answer a question the site has not yet defined.
Frequently Asked Questions
Can I calculate projector coverage from lumens?
No. Lumens describe visible luminous flux, while usable coverage also depends on optical distribution, effect type, throw geometry, target surface, ambient light, and the pass threshold. Use a matched site or sample test rather than a universal lumens-to-area conversion.
Does a longer throw distance mean a larger projector coverage area?
It can create a larger mathematical footprint when the projection geometry is fixed, but it does not guarantee a larger usable effect. Contrast, point density, focus, framing, surface, and ambient light can all make part of the larger footprint commercially unusable.
How many Christmas projectors do I need for a commercial facade?
Do not calculate the count by dividing total facade area by a catalog maximum. Divide the site into zones, validate the difficult representative conditions, and assign units from approved mounting positions with overlap, obstruction, viewing, power, and service access considered.
What does usable projector coverage mean?
Usable coverage is the part of the target where the agreed effect still passes under stated conditions. The definition should include distance, surface, ambient light, viewing position, effect-specific criteria, and a repeatable observation or recording method.
Are Bowlum’s 5–20 m and 50–300 m² ranges guaranteed?
No. Those catalog ranges for specific products had outdoor measurement and extrapolation behind them, but the original test conditions were not retained with the figures. Treat them as shortlist inputs and validate the exact product against the intended site.
Why does a projector SKU have no coverage figure?
A blank field means the source record does not provide a publishable distance or area value. It should trigger a sample test or a request for product-specific data, not an assumption that the product is weak or permission to copy a neighbouring model’s range.
What should I request when comparing two outdoor projectors?
Request the exact SKU and mode, the meaning and method behind each output figure, throw geometry, target surface, ambient-light condition, viewing or camera position, and an effect-specific pass criterion. Keep those conditions fixed across both samples.
"Luminous flux", https://en.wikipedia.org/wiki/Luminous_flux. A standard photometry reference defines luminous flux as the total quantity of visible light emitted by a source, whereas illuminance and related spatial measures describe how that light is distributed over a surface; thus, lumens alone do not specify projected footprint or visual usability. Evidence role: definition; source type: encyclopedia. Supports: The source should define luminous flux as a total photometric quantity and distinguish it from illuminance or spatial light distribution.. Scope note: The source establishes the photometric distinction but does not directly evaluate decorative projector performance. ↩
"Radiometry and Photometry: Review for Vision Optics", https://www.nist.gov/publications/radiometry-and-photometry-review-vision-optics. Photometric standards define the lumen through the standardized spectral sensitivity of human vision, distinguishing luminous flux from radiometric power measured without a visual-response weighting. Evidence role: definition; source type: institution. Supports: The source should explain that luminous quantities are weighted according to the standardized spectral sensitivity of human vision.. ↩
"Luminous flux", https://en.wikipedia.org/wiki/Luminous_flux. Lighting-engineering references describe beam angle and optical distribution as determinants of illuminance across a target, so equal total luminous flux can produce different field sizes and local brightness patterns. Evidence role: mechanism; source type: education. Supports: The source should show that beam angle and optical distribution change illuminance over a target even when total luminous flux is unchanged.. Scope note: This general optical relationship does not determine the visibility or acceptance of a particular decorative effect. ↩
"2019 Solid-State Lighting R&D Opportunities", https://www.energy.gov/sites/prod/files/2020/01/f70/ssl-rd-opportunities2-jan2020.pdf. Lighting-efficiency guidance distinguishes electrical input power from delivered luminous output and identifies source, driver, and optical-system efficiencies as separate contributors; consequently, wattage does not provide a universal conversion to lumens or coverage. Evidence role: mechanism; source type: government. Supports: The source should distinguish electrical input power from optical output and explain that efficacy depends on the source, driver, and luminaire or optical system.. Scope note: The cited efficiency framework supports the non-universality of conversion but does not quantify any specific projector. ↩
"The Geometry of Perspective Drawing on the Computer", https://www.math.utah.edu/~treiberg/Perspect/Perspect.htm. Geometric projection theory shows that, for a fixed angular field, projected linear dimensions increase approximately in proportion to target distance; the corresponding rectangular footprint therefore increases approximately with the square of distance under the simplified model. Evidence role: mechanism; source type: education. Supports: The source should support the similar-triangle relationship between fixed angular field, target distance, and projected dimensions.. Scope note: The relationship assumes fixed geometry and does not account for lens distortion, cropping, oblique surfaces, or visibility thresholds. ↩
"Spatial frequency discrimination in normal vision ... - PubMed", https://pubmed.ncbi.nlm.nih.gov/7139253/. Research on contrast sensitivity and spatial resolution indicates that visual discrimination depends on both contrast and the spatial scale of image features, providing a perceptual basis for reduced point density or pattern legibility as a projection is enlarged. Evidence role: mechanism; source type: paper. Supports: The source should explain how increased spatial separation, reduced contrast, or lower sampling density can impair visual discrimination and image recognition.. Scope note: General vision research does not establish a universal distance threshold for any particular projector or decorative pattern. ↩
"A Method of Computational Correction for Optical Distortion in ...", http://www.cs.unc.edu/techreports/93-045.pdf. Projection and imaging references show that lens geometry, focus, target orientation, and image framing affect the shape and sharpness of a projected field, while physical obstructions can truncate the illuminated region rather than produce an unobstructed cone. Evidence role: mechanism; source type: education. Supports: The source should describe how projection angle, lens geometry, focus, image cropping, and target orientation alter projected shape and sharpness.. Scope note: The source supports the contributing mechanisms but does not model the specific housing or optics shown in the article. ↩
"The Lighting Design Objectives (LiDOs) Procedure", https://ies.org/fires/the-lighting-design-objectives-lidos-procedure/. Professional lighting guidance evaluates visual performance through criteria such as illuminance, uniformity, contrast, and viewing conditions, supporting the distinction between a geometrically illuminated area and an area in which the intended visual effect remains acceptable. Evidence role: expert_consensus; source type: institution. Supports: The source should demonstrate that lighting assessment uses measured or agreed criteria such as illuminance, uniformity, contrast, or visibility rather than geometry alone.. Scope note: General lighting criteria may not map directly onto decorative effects such as moving ripples or projected holiday images. ↩
"Effects of luminance, contrast, and blur on visual acuity", https://pubmed.ncbi.nlm.nih.gov/8749333/. Vision research indicates that detection and discrimination depend on target-to-background contrast and the observer's adaptation luminance, supporting the practice of recording normal ambient lighting when evaluating a projected effect. Evidence role: mechanism; source type: paper. Supports: The source should show that background luminance and adaptation state influence contrast sensitivity and visual detection.. Scope note: The research concerns visual perception generally and does not define an acceptance threshold for a specific commercial facade. ↩
"White Balance - Understanding Exposure for Photography ...", https://researchguides.library.tufts.edu/c.php?g=1164236&p=8498964. Imaging-measurement guidance notes that exposure, camera response, white balance, dynamic range, and viewpoint can change recorded brightness and colour, so photographs are more comparable when the camera setup and settings are controlled. Evidence role: mechanism; source type: institution. Supports: The source should explain why exposure, white balance, dynamic range, viewpoint, and camera processing affect recorded appearance.. Scope note: Controlled imaging improves documentation but does not replace calibrated photometric measurement or direct observer assessment. ↩